MYCMS
Diagnostics of your Machinery
A good condition monitoring system can provide early detection of equipment degradation to prevent consequential damages. With myCMS, you can shift your maintenance from preventive to predictive.
WHY CONDITION MONITORING SYSTEM?
What to expect when installing the Condition Monitoring (CMS) system:
.

Increase availability

Minimize downtimes

Reduce maintenance costs
.
.

Prolong machinery life
Save labor cost

Improve quality
.
VIBRO-ANALYSIS TO THE RESCUE
myCMS uses the Vibro-analysis to detect system failures and degradation
Detection and prediction of equipment failures can be made by multiple methods such as sound analysis, temperature measurement, etc. The Vibro-analysis gives the earliest detection possible by monitoring subtle changes in the vibration signal.
WHAT CAN VIBRO-DIAGNOSTICS DETECT?
myCMS uses state-of-the-art scientific methods to detect various possible problems with your machinery. Multiple markers in parallel are used for the best possible detection. Based on the detection markers, the following machine conditions can be evaluated*:

Misalignment

Friction

Unbalance

Bearing

Tooth-faults

Belt
.

Cavitation

Contamination

Impact

Looseness

Cracks
*Every mechanical system is different, and also operational condition in each location are different. The overall reliability of myCMS system should be evaluated by a customer case by case.
HOW IT WORKS?
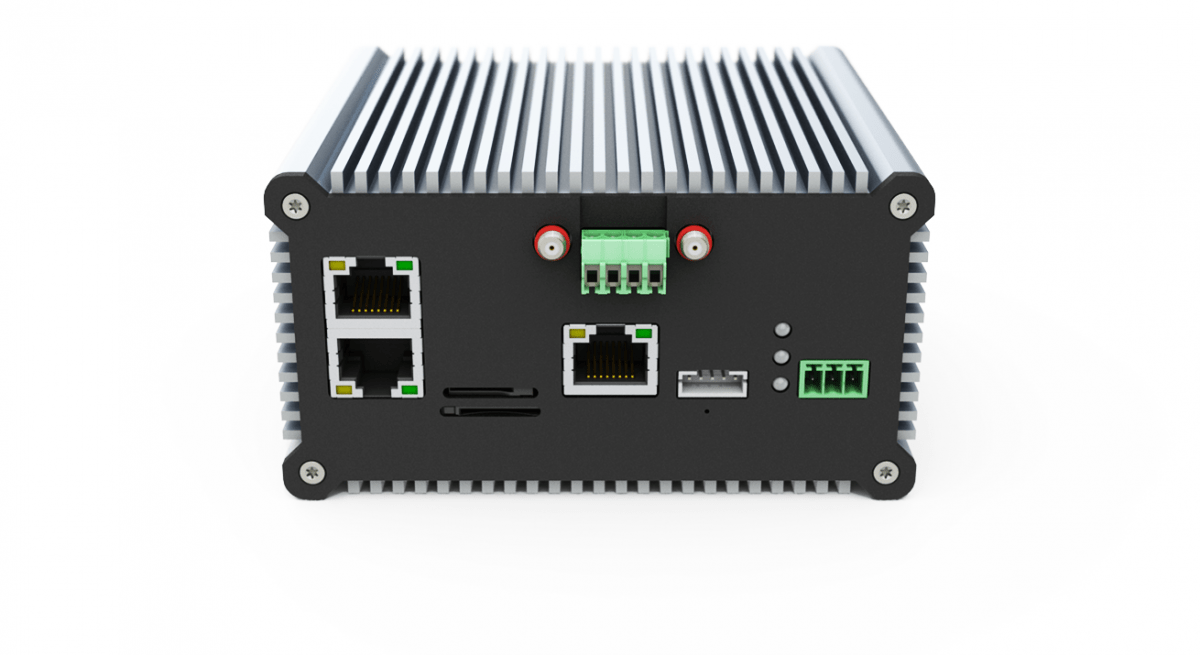
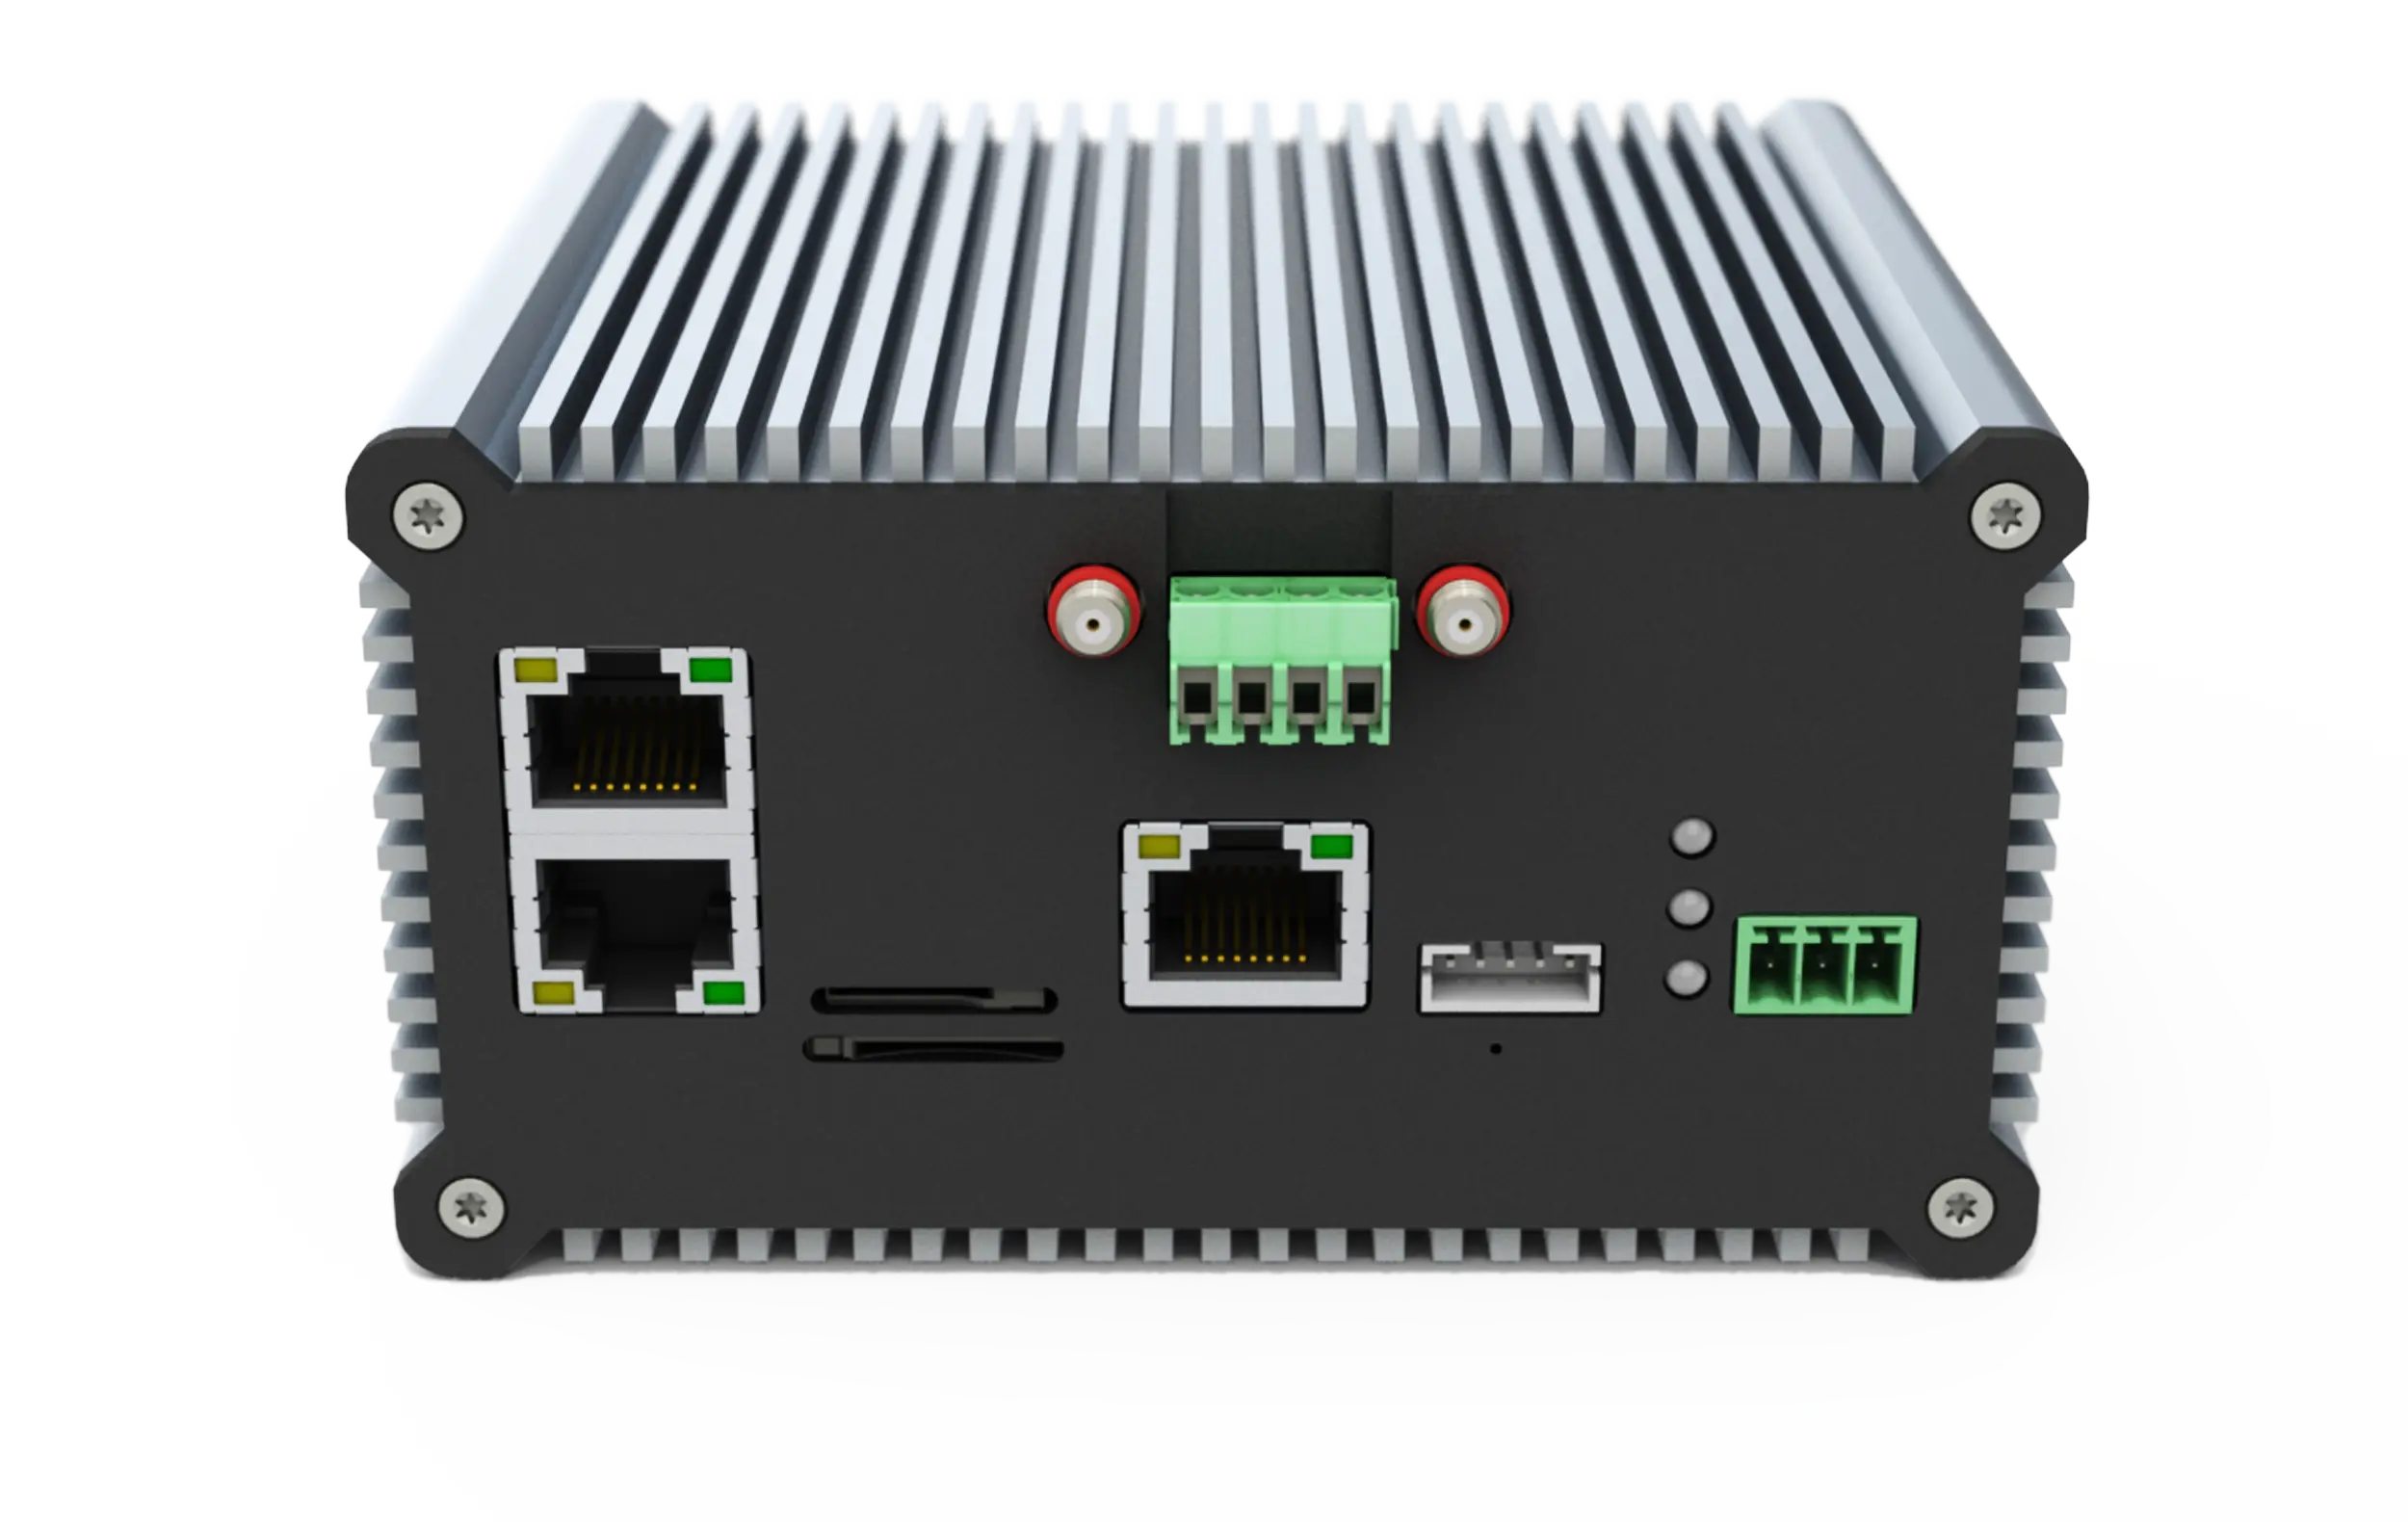
myCMS device uses acceleration sensors to measure the vibration levels. The myCMS unit has two channels to connect up to 2 sensors. Using the signal analysis, the multiple descriptive markers are computed. So, for example, from the acceleration signal, the velocity and displacement are calculated using integration formulae.

MAIN FEATURES
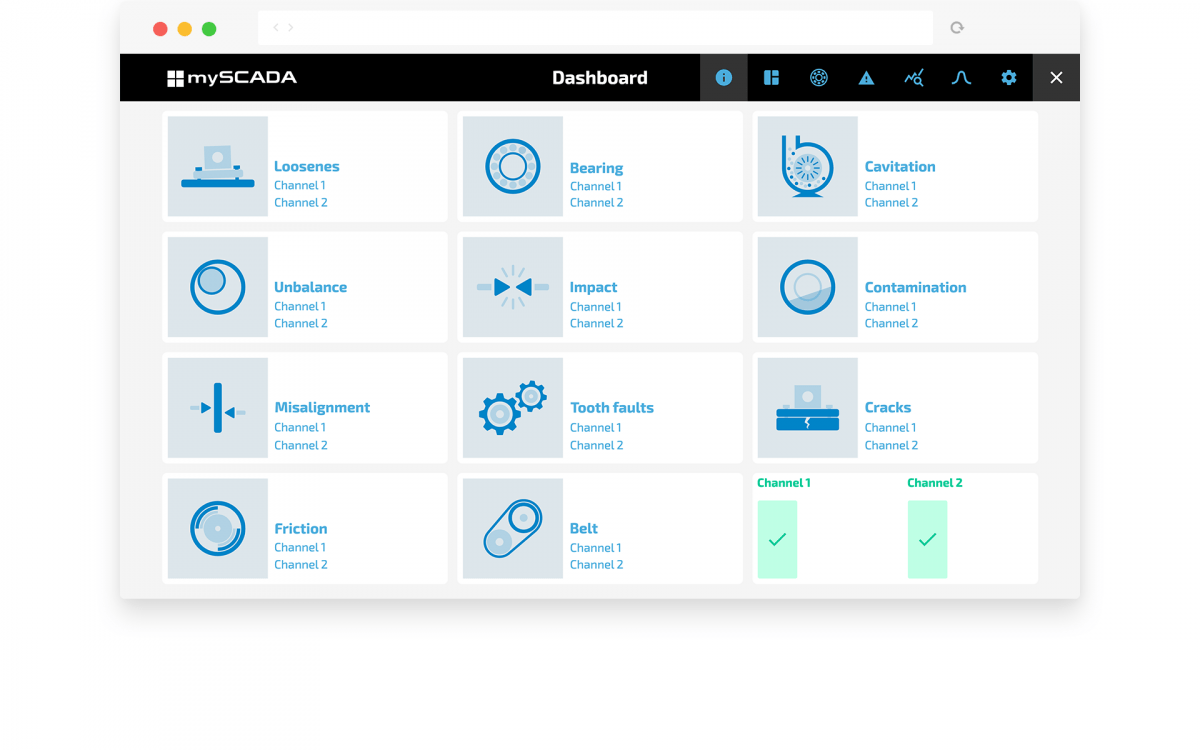
Dashboard
When the condition of your machinery changes, myCMS system analyses the difference and shows you the possible root cause of the issue.
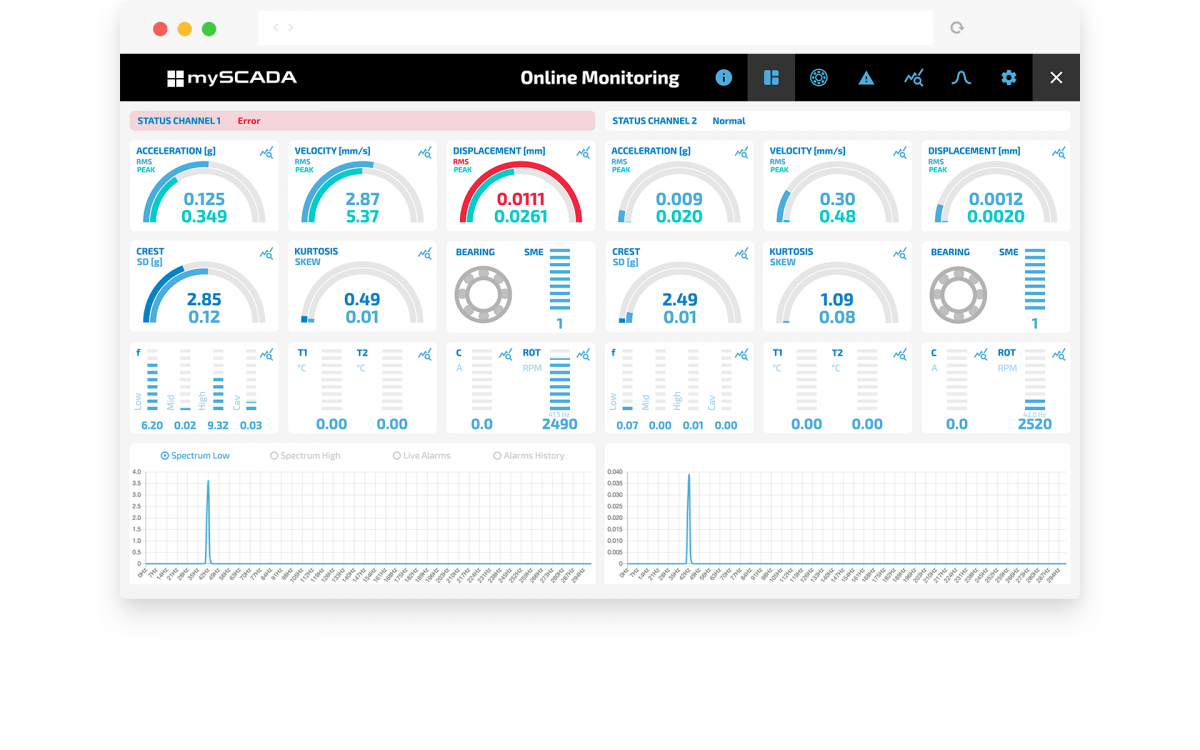
Online Monitoring
Get a real-time overview of all detection markers in one view.
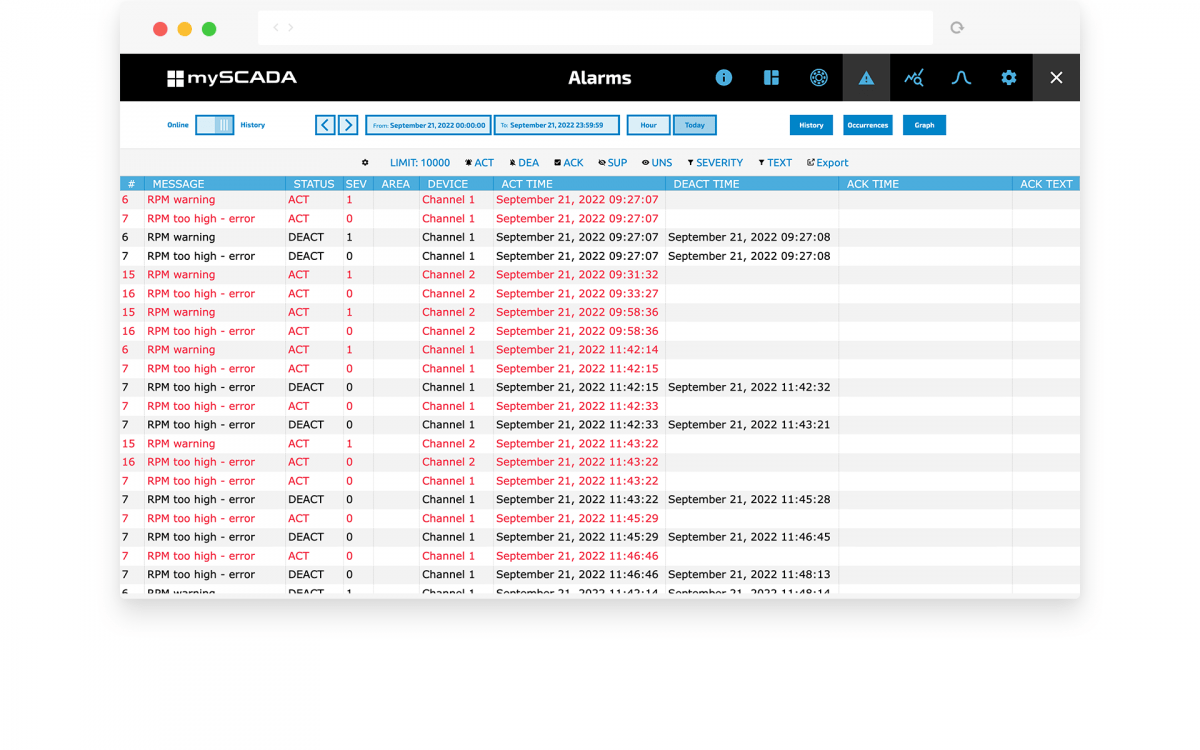
Alarms
myCMS unit monitors your technology 24/7, continuously computing detection markers. When any marker reaches the limit, the alarm is activated.
You can be automatically notified by email or SMS.
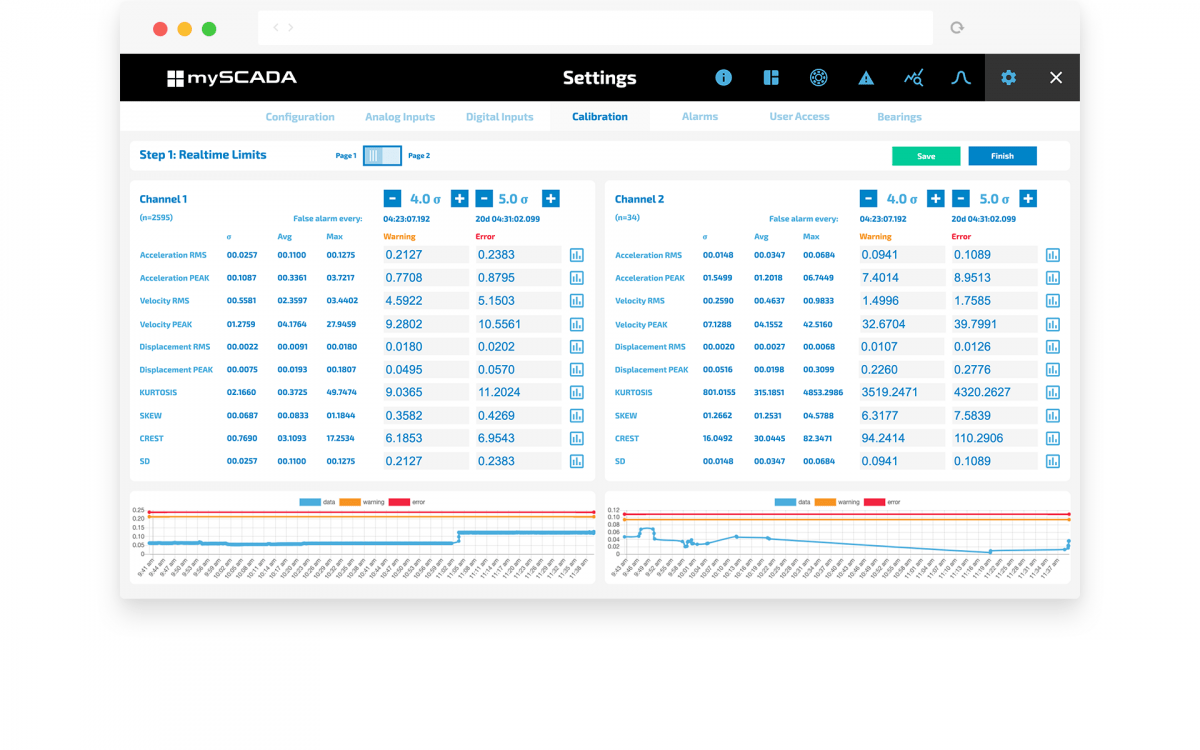
Automatic calibration
As finding a proper level for detection metrics (e.g. alarm limits) can be complicated, myCMS provides the auto-calibration routine.
The process is simple and straightforward:
- Let the machinery run for a couple of hours to collect data.
- The system will automatically compute optimal alarm levels for each metric.
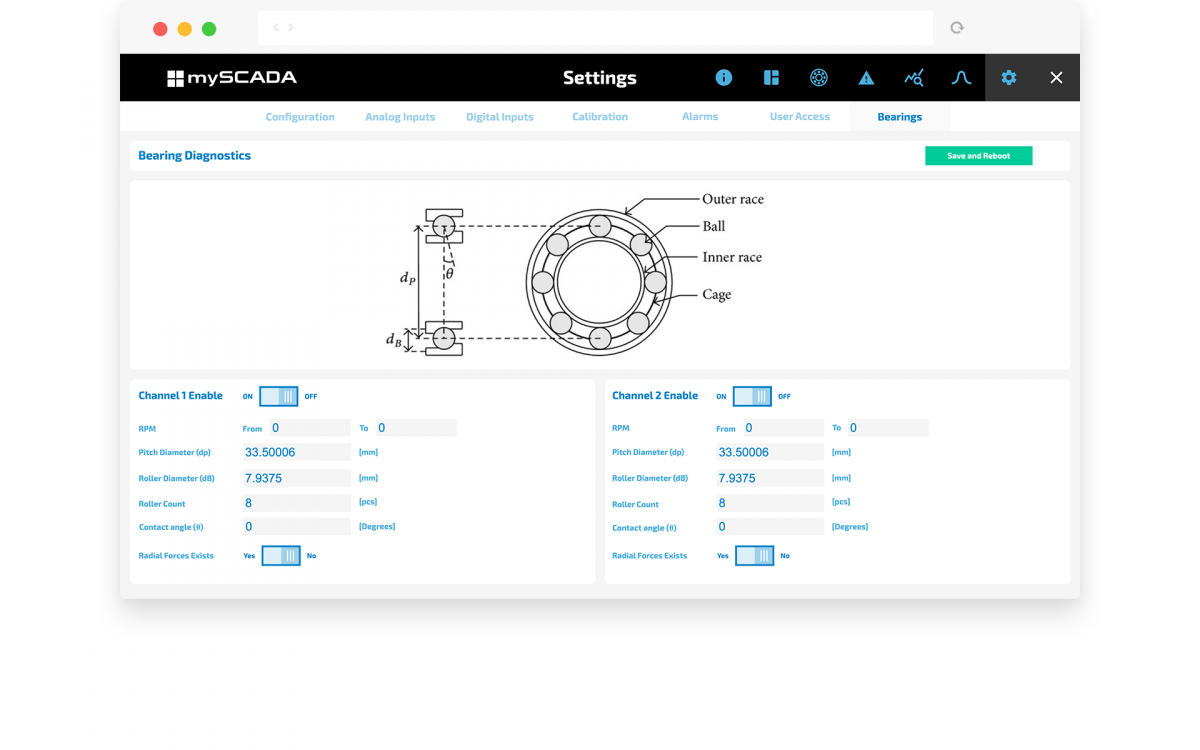
Advanced bearings diagnostic
myCMS system provides advanced bearing diagnostics based on frequency spectra analysis. The process is fully automatic. The end user needs to provide the mechanical dimensions of the bearings. From this, the primary frequencies are calculated, and bearing can be diagnosed. For advanced bearings diagnostics, the RPM needs to be measured.
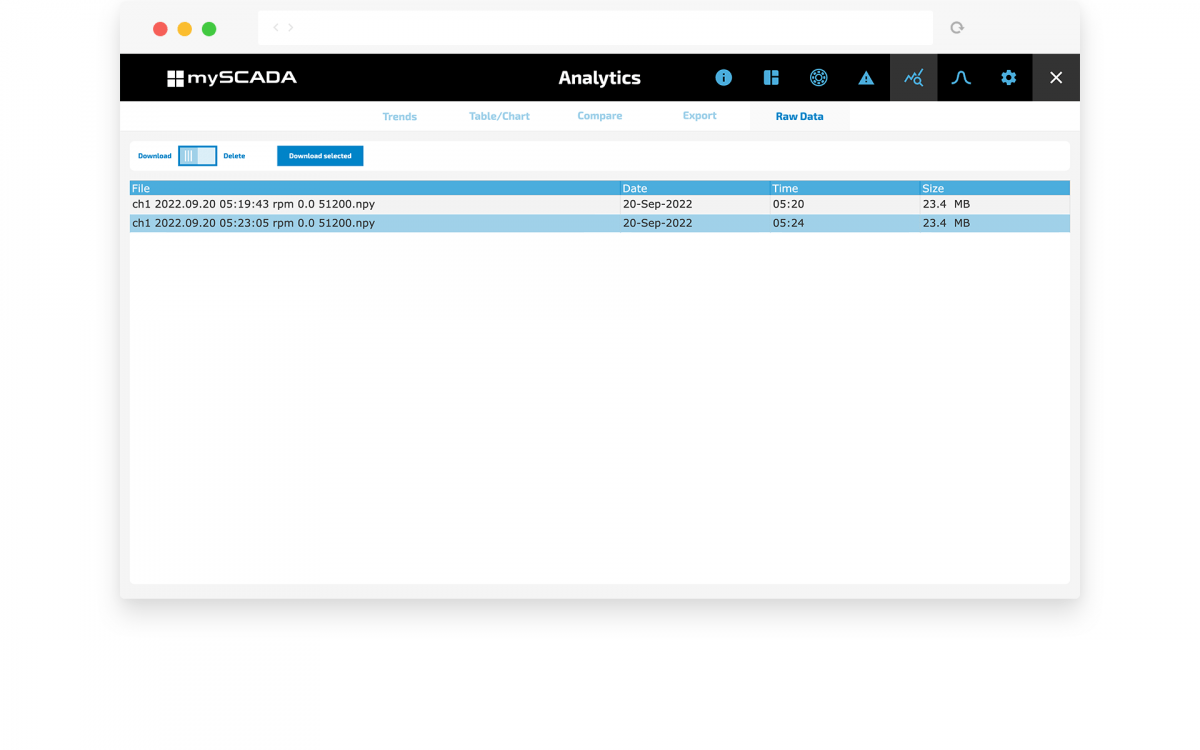
Data storage
myCMS unit has sizeable internal storage for historical data. Depending on HW configuration, up to 1TB can be used. All the computed detection markers, alarms, and frequency spectra are logged into the internal database.
Even raw data of measured signals can be logged on the filesystem of the unit. Multiple data formats such as binary, CSV, or NumPy can be selected for simple further processing.
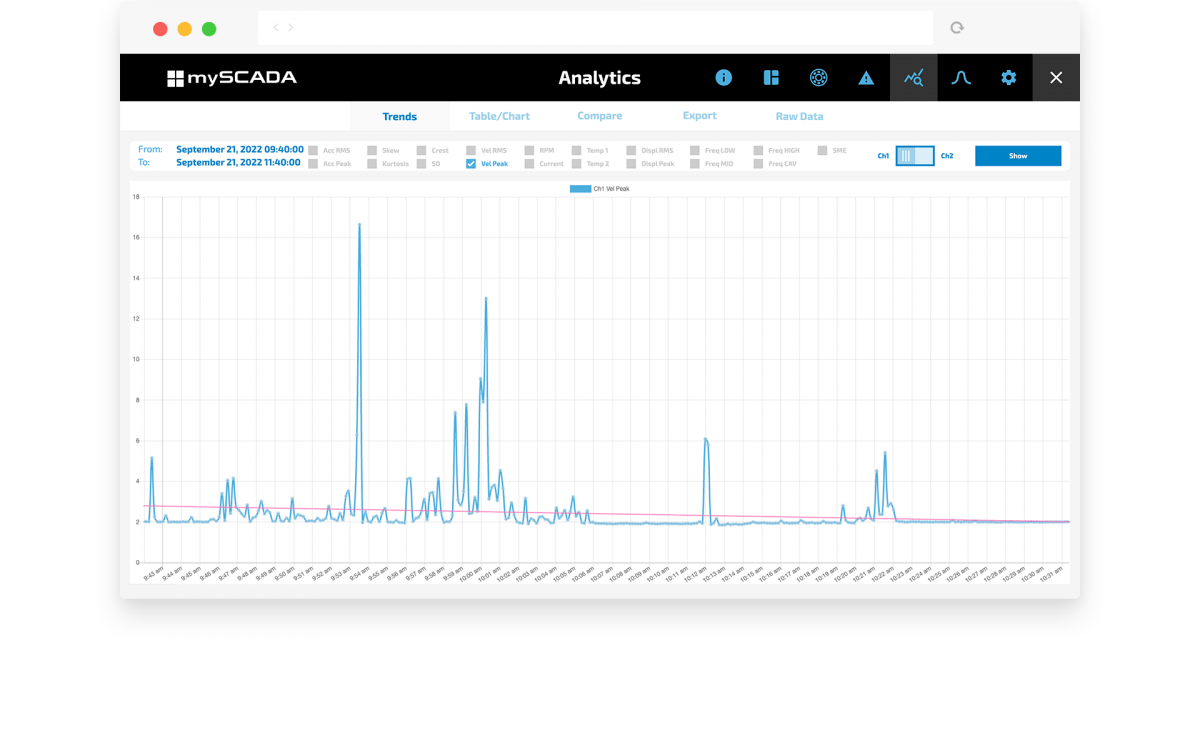
Long time trends
Long-time trend monitoring is perfect for watching the progress of your machinery condition. Every detection marker can be plotted and analyzed.
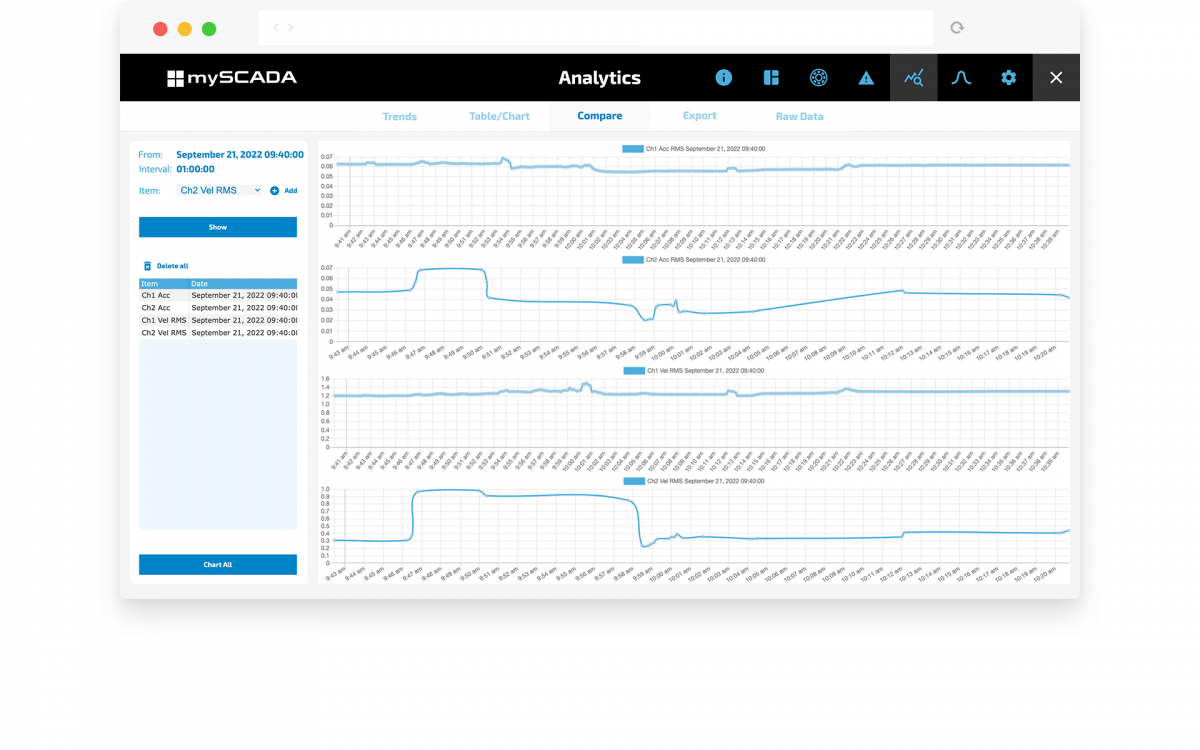
Comparative view
Using a comparative view, you can compare either:
- Compare the selected marker in specified time intervals (for example, during standard and nonstandard situations).
- Compare different markers among each other.
Frequency Analysis
myCMS unit, due to its powerful hardware, allows for online frequency analysis. Live computation of power spectra can track any change in the frequency response of your machinery. An alarm can be triggered.
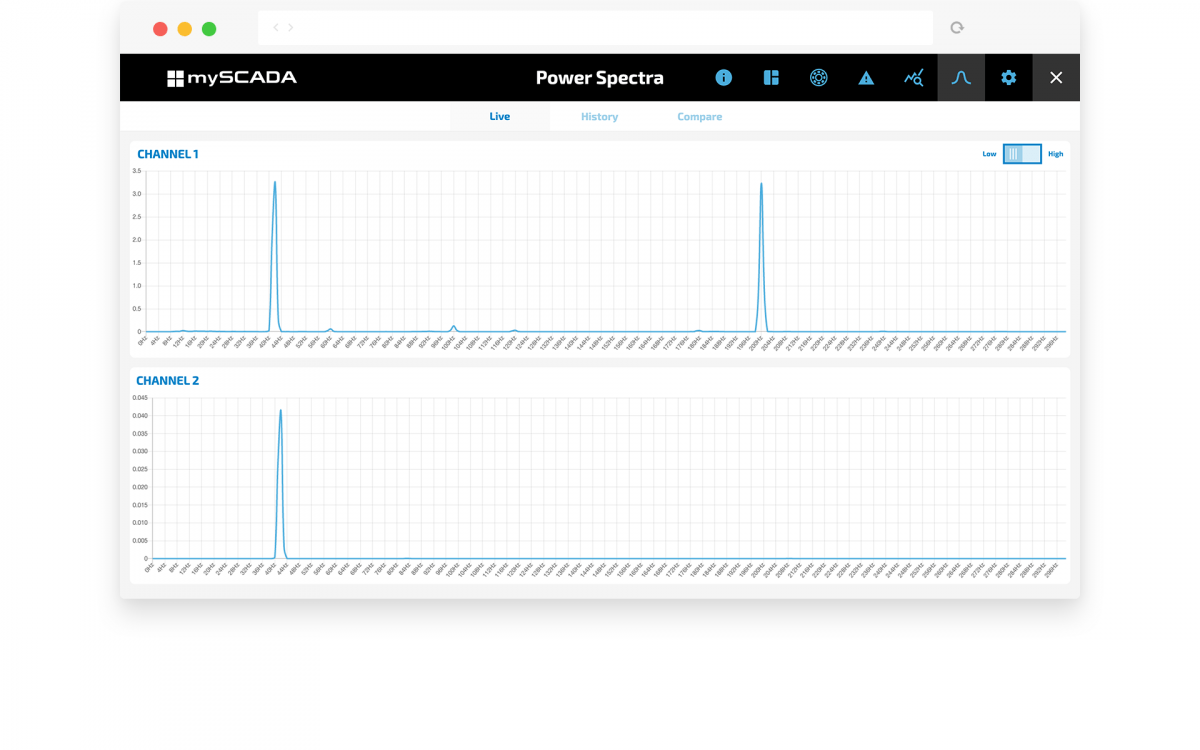
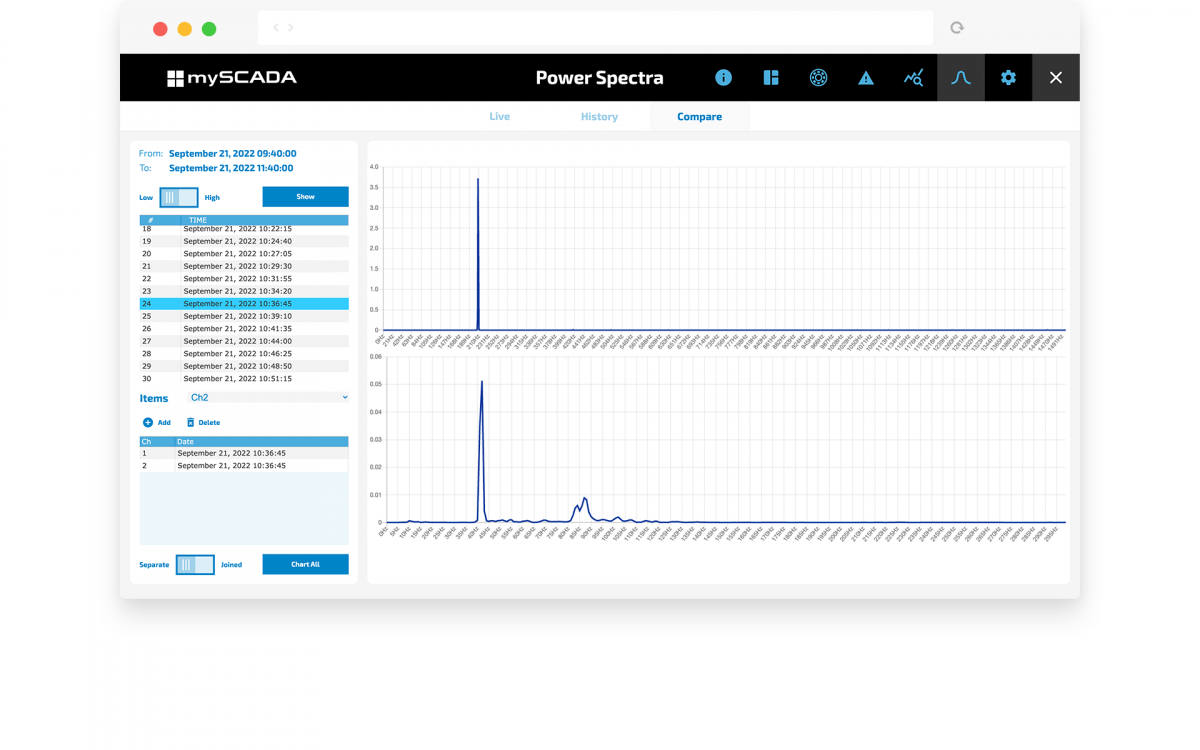
Power Spectra Comparative View
Track how the frequency response of your system changes in time by power spectra comparison.
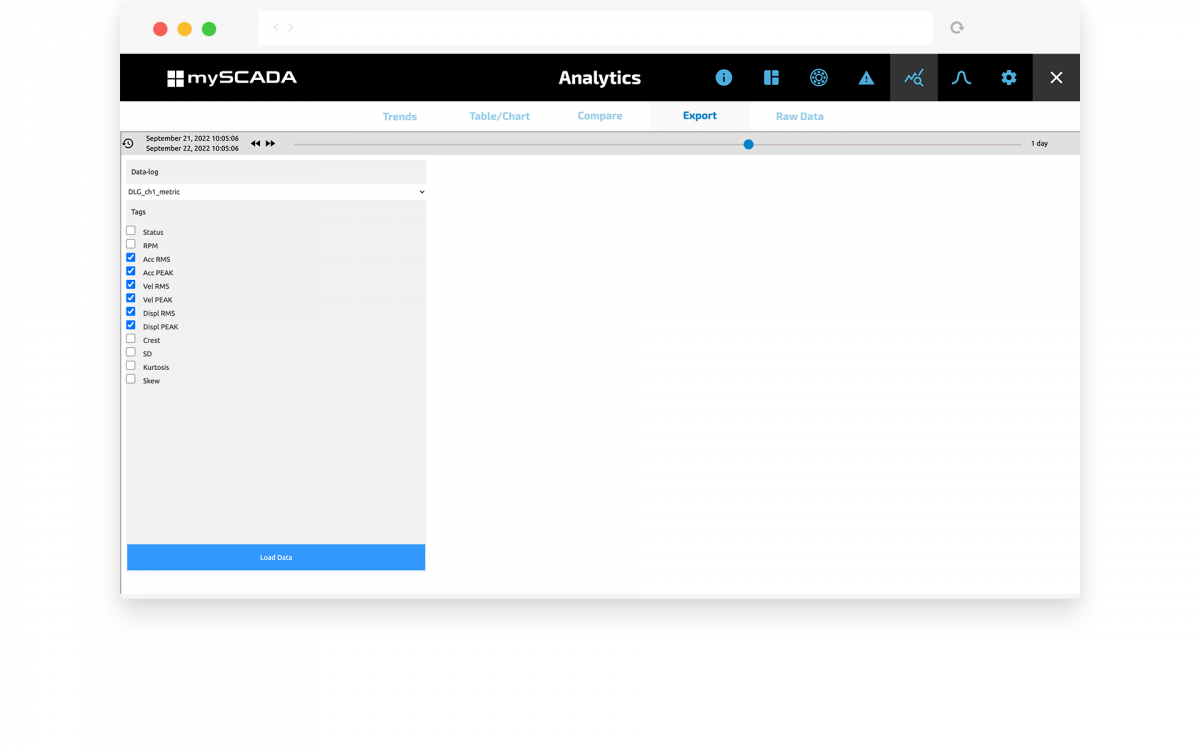
Data Export
- Export any logged data into MS Excel.
- Download raw signal data.
- Use REST API to get any data into your IT system.
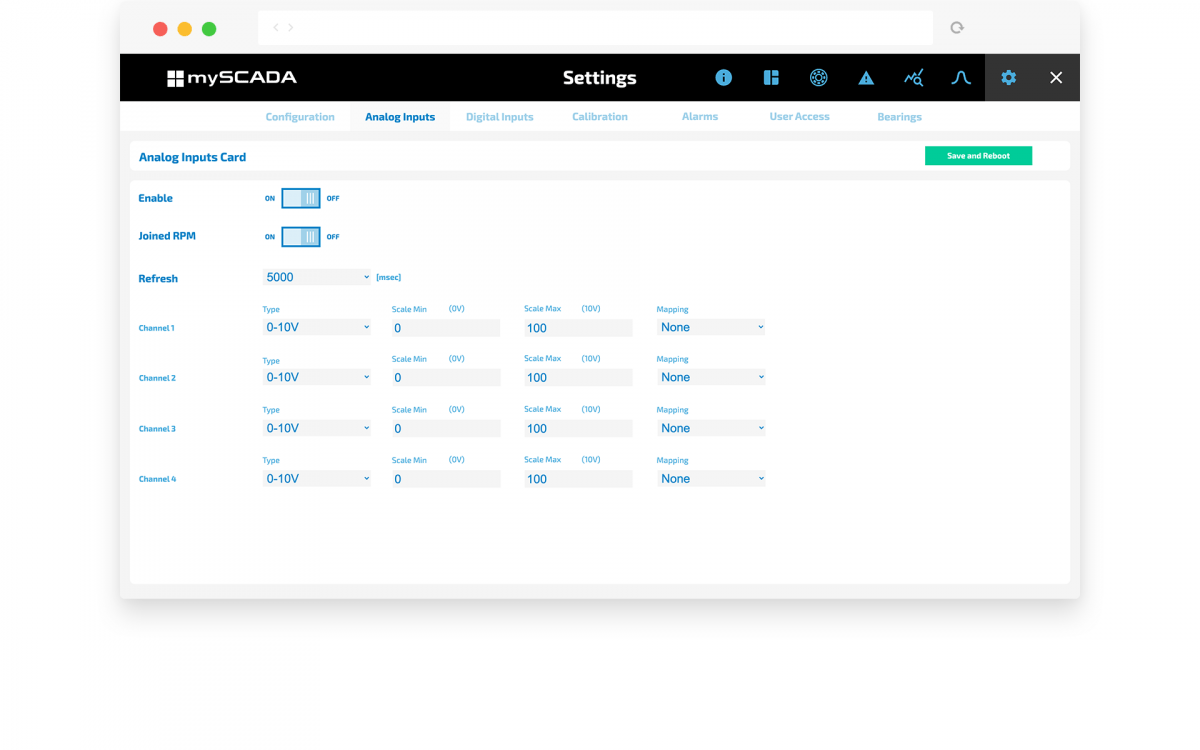
Settings
Easily set up your unit from your web browser. The basic setup is easy. Just select sampling frequency and sensor sensitivity and you are ready to go. However, you can fine-tune any parameter in advanced settings.
TECHNICAL DETAILS